In the previous post, we got up to speed with the basics of what a VNA is and how to run a basic calibration. In this post we will look at configuring the traces and formats.
Note on Charging – One note, before we go deeper. My NanoVNA doesno like to charge from my PC USB type C port or my Samsung Quick charger. Use a regular USB-Type-A from an less intelligent charger and it’s fine.
Configuring Traces, Channels and Formats.
Throughout this guide, I will assume you are using a stylus(or your finger) to control the NanoVNA via the touchscreen. You can of course use the rocker control to perform all these applications.
The default firmware(on my VNA at least) provides 2 traces (Yellow= TRACE 0, Blue= TRACE 1). The current ‘active’ trace is highlighted at the top left. Any changes you make will be made for this trace.
To make a trace ‘active’
Enter the DISPLAY menu.
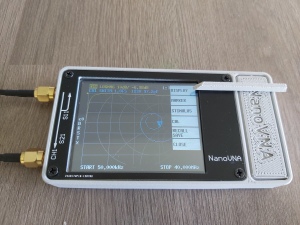
Display Menu. Current Active Trace is 0(Yellow)
Now select the TRACE menu.
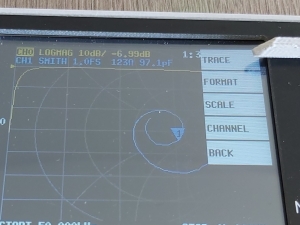
TRACE menu
Select the trace you want to change.
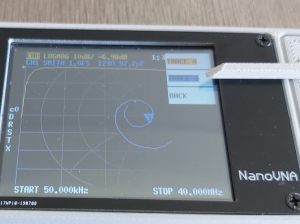
Select Trace
Your selected trace should now be highlighted. You can also turn off this trace by selecting OFF, or turn off the other trace by selecting SINGLE.
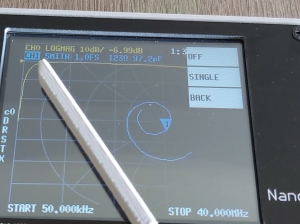
Trace now active. Currently measuring channel 1(S21).
To select the Channel
Again from the DISPLAY menu. Select CHANNEL.
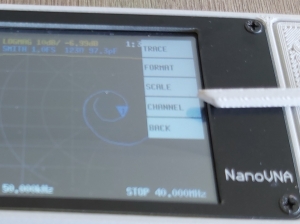
CHANNEL menu
You now have two options. CH0 REFLECT, or CH1 THROUGH. This equates to S11 using only the top RF port or S21 measuring the transmission from the top to the lower RF port.
To select the format
Located in the FORMAT menu under DISPLAY. You can now choose from a range of graphical presentations.
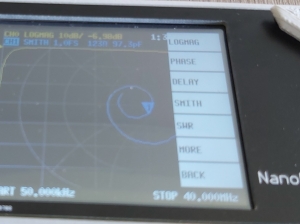
FORMAT menu options.
The most common use cases will probably be LOGMAG, SWR and SMITH. I tend to use LOGMAG for transmission measurements(S21) and either LOGMAG or SMITH for S11.
LOGMAG/SWR/LINEAR/PHASE/SMITH/POLAR
LOGMAG – For S11 measurements this is the Return Loss and is measured in dB. For passive networks it will always be below negative. For S21 measurements this is the INSERTION LOSS in dB.
SWR – The Standing Wave Ratio, often also called Voltage Standing Wave Ratio(VSWR), is often used for measuring antennas. I think this is purely for historic reasons, as LOGMAG or LINEAR are generally more easily understood. For S11 measurements and SWR of 1 is a perfect match(zero reflected power). The figure is normally quoted as a ratio I.e 2:1. An antenna SWR of 3:1 would normally be considered good, while better than 2:1 would be excellent. You can use SWR for S21 measurements, but i’m not really sure why anyone would do so.
LINEAR – Same as LOGMAG, but expresses as a ratio. For S11; 1 would be 100% power reflected, 0 would be 0% power reflected.
PHASE – The relative phase difference between the signal source(always top port for NanoVNA) and received signal.
SMITH – This is just the LINEAR and PHASE plots combined onto a polar co-ordinate system. The marker readings in this format will display the equivalent Resistance and Inductance/Capacitance for marker frequency.
POLAR – Same as SMITH, but provides marker readings as a complex number.
Coming Soon
I had intended to start to show some examples of using the NanoVNA in this post, but I think that content is too interesting to be buried under all this basic setup info. And also, the battery went flat on my unit(see my note on charging at top), so I couldn’t actually make any measurements.
However, in the next post I promise I will actually show the unit making some real measurements.


 My Things
HI, I am a first time user of the Nano, however I am a 80 year old communication design engineer. I rarely use Smith charts so the display is distracting, I only use R and j numbers in everything I do. What is the easy way to get the display to show swept response where the marker will read frequency and R and j only. Thanks.
Mel
Hi Mel,Are you using the nanoVNAsaver PC software. Its really easy to use and works on Windows Linux etc. Part 3 of this blog shows how to install it and connect your nanoVNA.
The software has improved a bit since I wrote that, but most of it still applies.
In nanoVNA saver, you can click on “Display setup…” which will open a window with an option to select the displayed chart. R+jX is one of the options. Additionally the markers provide this by default.
I don’t have my nanoVNA with me at the oment so I cant check through the menu on that to see if its possible on the device. I suspect it is there somewhere.
Hello, I want to connect to my pc’s and start recording my results. there is a mention on one video about shorting some pins on the nanovna to go into pc mode….ha ha no one seems to bother to say which pins or show where they are located….nice one!!
Also, as a startup comment, when i started with my vna i managed to stop it from scanning…
I tried everything but it wouldn’t scan. im sure this happens to a lot of “new users”, nobody mentioned that you MUST use RESET in calibration , then do all the calibrations to save a new freq scan…and reboot the device for the new setting to become active. ok now i’ve got that and have loaded in 5 different sweep profiles in memories 0 to 4, ( mem 1 to 5 would have been more user friendly) and it runs like a dream..but i had to post a help !!! on qrz.com to get someone to give me the solution.
When starting with a new user, it’s imperative to explain that to do a new set of tests, you can set the frequency parameters then you MUST do a calibration before loading this into the memory…and use the RESET first to clear any old data..
However, this led to another question, while looking for a way to get the vna scanning again i looked into the settings SCALE, no one seems to mention much about what these settings are or can be set to. This may be common sense to you and me, but even I wondered what the default setting under reference position and electrical delay should be set to …i was thinking this could have been the cause of the ” non scan” lockup…
Finally i’ve designed a CAL unit, that ill be posting on my qrz.com page, ( f5vhz) using an old pellet tin, a bnc chassis connector, two miniature coaxial switches, and a 50 ohm resistor, ive made a handy tool for calibrating that connects to a BNC / smae connector on the end of the supplied cable that came with the nanovna. this is my permanent cable bnc interface to use for all my antenna testing..its fine right up to almost 900 mhz. Certainly fine for HF, VHF, UHF where im using it up to 500 mhz.
A simple guide to the smith chart is YOU-COAX-AND SMITH published by JOKALYM PRESS – sold by DX Engineering and KJI Electronics
Hello. Why is LOGMAG negative dB? I can understand an antennas reflection of 2
dB. subtract 2 from the link budget. But I’m getting negative 14 dB… how do I interpret this?
Positive numbers would indicate more power being reflected than you put in. Unless there is an amplifier in the system this number will always be negative.
i update my NanoVna to latest firmware..i have two antenna for walkie talkie..fake Nagoya NA 771 and Harvest RH 660S Telescopic for 2m/70cm….after i reset my NanoVNA, it is normal as reading is ok…but after calibrated SWR went high sky and up/down…