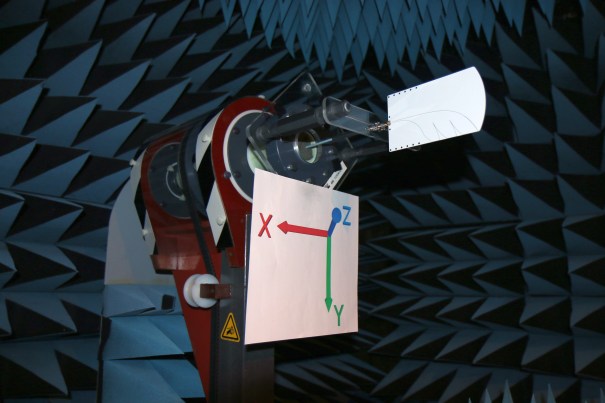
Antenna being tested in anechoic chamber
My Vivaldi Antenna was recently tested by Antenna Test Lab who offer an excellent professional antenna testing facility. Antenna Test Lab are able to provide customers with full 2D/3D antenna measurement using their anechoic antenna testing chamber.
Accurate and repeatable antenna evaluations generally require expensive lab equipment (like an anechoic chamber) and a surprising amount of knowledge and skill. Antenna Test Lab Co is a commercial testing lab, and they have done an excellent job on this project. I shall use this post to go through some of the results from my antenna evaluation. You can download the full set of measurement data including 3D plots here.
Antenna Test Lab have also created and excellent series of educational pages that detail many aspects of antenna performance and measurement.
Results
The antenna was measured from 1.4GHz to 18GHz in 25MHz steps. That’s a lot of data that Antenna Test Lab have kindly presented in an easy to use spreadsheet.

Forward Gain – 1400MHz to 18GHz
Firstly this plot shows the forward gain and represents the realized gain in the intended direction of radiation. For many frequencies this is the same as peak gain, however at some frequencies the actual peak is slightly skewed from boresight.
The area’s labelled note 1 show where forward gain is reduced. As will become clear in later plots, this is primarily caused by a change in the antenna pattern rather than any lack of efficiency at these frequency.
For first section (1.4 to 1.6GHz) as described in my previous posts, the antenna is not really acting as a classical vivaldi directional antenna and actually has a somewhat more omnidirectional pattern.
At around 2.1GHz their appears to be a slight skew in the elevation pattern. This is due to the coax sheild being directly connected to one arm while the other arm is shielded inside the coax. Hence the small reflections at this frequency (VSWR = 2.6 here) do not effect the pattern equally.
As can be seen in the plot, the antenna has positive gain up to nearly 18GHz, although analysis shows that the beam pattern becomes very messy above about 9.3GHz.
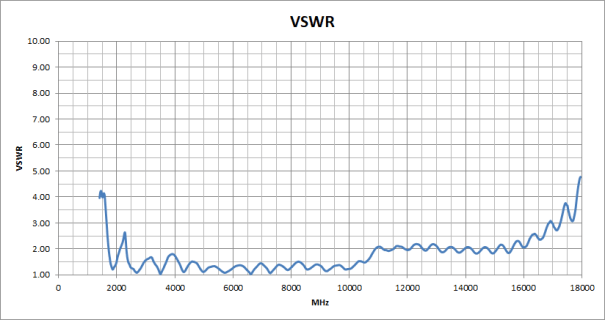
VSWR – 1400MHz to 18GHz
VSWR/Return loss is good all the way up to about 16GHz, however as can be seen in the efficiency plots this does not exactly translate into good radiation. A regular refrain in antenna engineering is that while bad VSWR guarantees poor radiation, good VSWR does not guarantee good radiation. This is clear in these two plots where the VSWR is near constant between 11 and 16GHz, while the efficiency tails off rapidly. In this antenna it is highly likely that much of the power is being absorbed by the FR4 substrate.
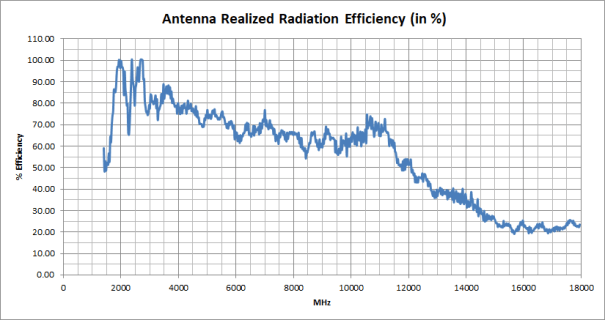
Antenna Efficiency
For the design frequencies(up to 6GHz) the efficiency generally above 70%. Trust me, that is not bad for a antenna. In terms of transmit and receive range it is hardly noticeable.
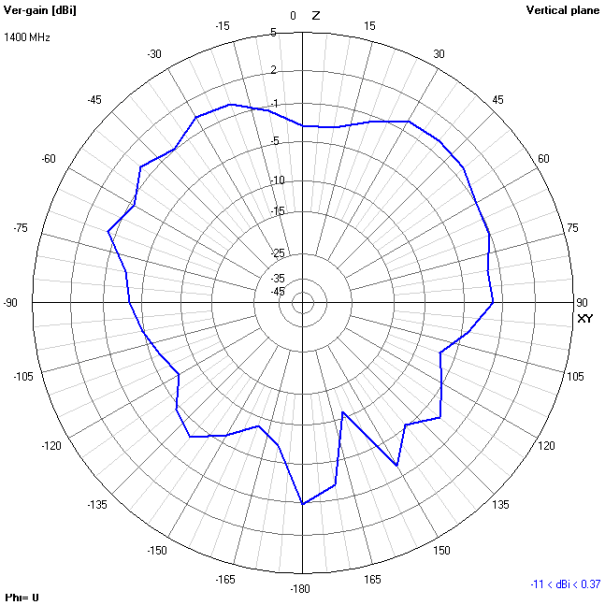
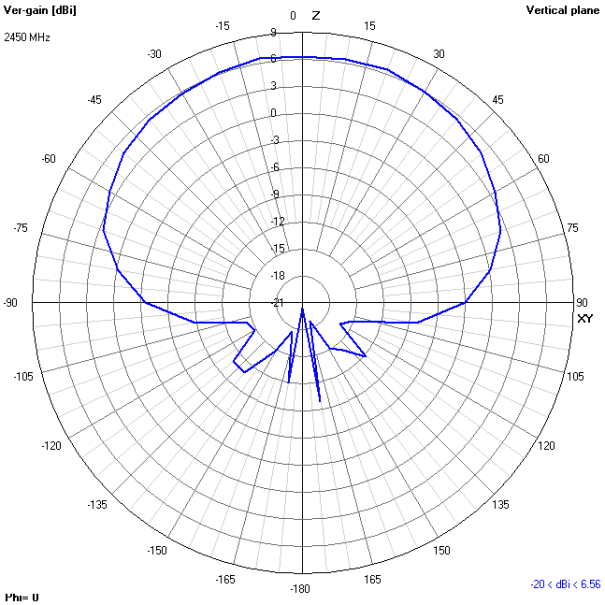
Antenna Patterns
Below are a series of Azimuth and Elevation plots derived from the 3D data file and plotted using 4Nec2. As can be seen at 1.4GHz, the antenna is still efficient, but is no longer directional. As frequency increase (with the exception of the dip at 2.1GHz) so does the gain.
As a rule the antenna generally presents a tighter elevation pattern than azimuth.
Front to back ratio is generally between 10 and 20dB from 2GHz to 6GHz
-
- 1.4GHz Azimuth
-
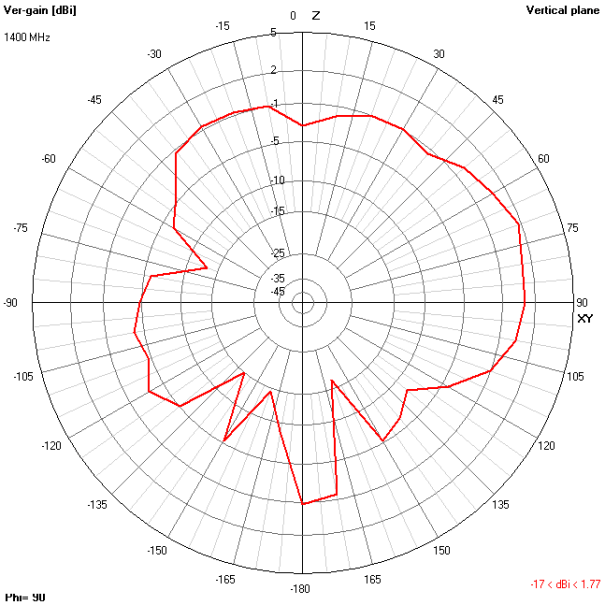
- 1.4GHz Elevation
-

- 1.8GHz Azimuth
-

- 1.8GHz Elevation
-

- 2.125GHz Azimuth
-

- 2.125GHz Elevation
-
- 2.45GHz Azimuth
-

- 2.45GHz Elevation
-

- 4GHz Azimuth
-

- 4GHz Elevation
-

- 6GHz Azimuth
-

- 6GHz Elevation
3D plots
As discussed the antenna measurements contain full spherical measurements. This is best viewed using the tools Antenna Test Lab link to, but the below animation shows the pattern at 6.25GHz

6.25GHz 3D plot


Loved reading thiis thank you